♦ Should we avoid high purine foods from animal sources for better health?
Purines are the building blocks of DNA and RNA (nucleic acids; adenine, guanine, hypoxanthine, xanthine) and are found in every living organism; probably the most abundant molecule in nature.
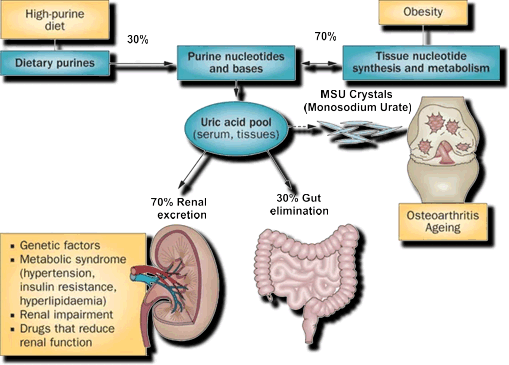
The two sources of purines our body must process are endogenous and exogenous; i.e. originating from bodily processes, such as the breakdown of cells, and from the foods we eat.
During the metabolic process these purines are broken down into the end product uric acid (C5H4N4O3), which needs to be excreted or it will form crystals in places like the kidneys, joints and soft tissue.
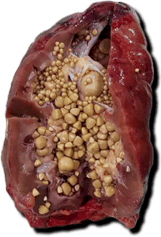
If there is a buildup of uric acid in the body from the break down of high protein animal foods then Hyperuricemia ensues which can lead to a host of diseases such as Gout, Kidney Stones and Uric Acid Crystal deposits in joints. [γ]
Much has been written about acid/alkaline diets, and there is ample evidence that overall a more alkaline diet is highly beneficial for health and recovery from disease.
As always, a balanced approach is advisable and also necessary.
First, acidic condition forming foods just can't be avoided, and second they are necessary for optimal metabolic functioning and a host bodily process.
The Uric Acid and PRAL scores (Potential Renal Acid Load) below are only provided as a guide to selecting foods which are deemed to either increase, or reduce the acid load on kidneys and as such are overall beneficial to health.
• Both scores can be used as a guide to avoid highly acidic foods and selecting more alkaline foods, which scientific studies have shown to:
- Reduce the acid load on kidneys [γ][ε]
- Provide more beneficial nutrients; vitamins, minerals and fiber, for good health, longevity and recovery from disease. [β]
- Improve the K/Na, Potassium/Sodium balance which is beneficial for health and recovery from disease. [α]
- That an alkaline diet resulted in an increase in growth hormones which in itself is highly beneficial for health and recovery from many diseases.
- To reduce the intake of saturated fats and thus preventing heart disease and many other degenerative diseases like cardiovascular disease, cancer, chronic respiratory diseases and diabetes. [Δ]
- Decrease salt intake which leads to hypertension, hardening of the arteries and kidney disease.
♦ Selecting a more alkaline, healthy and balanced diet based on:
- Fresh, green leafy Vegetables, Carrots, Tubers, Pumpkins, Cucumbers
- Soy Proteins like: TVP, Tofu, Miso, Tempeh, Natto, Soymilk, Lentils, Beans
- Occasional small amounts of Seafood or fresh water Fish, Oysters
- Carbohydrates like: Brown Rice, Millet, Amaranth, Quinoa, Oats, Wheat
- Fats & Oils like: Nuts, Avocado, Sunflower Seeds, Sesame and Olive Oil
- Seasoning like: Sesame, unprocessed Sea-salt, Soy-sauce
- Drinks like: Green Tea, Kukicha, Herbal Teas
- Snacks like: Nuts, Seeds, Puffed Rice Crackers, Dates, Raisins, Apricots, Bananas, Fruits
While the PRAL Score Formula has been challenged for its assumption that an increase in phosphate increases the PRAL Score and should increase urinary calcium loss and result in a negative calcium balance in bone, it can be a useful guide in selecting alkaline foods. [α]
PRAL formula:
PRAL (mEq / 100 g) = 0.49 x protein (g/100 g) + 0.037 x phosphorus (mg/100 g) − 0.021 x potassium (mg/100 g) − 0.026 x magnesium (mg/100 g) − 0.013 x calcium (mg/100 g)
♦ Following a Table listing Foods sorted according to their Uric Acid conversion during metabolism and their PRAL Score.
The second Table is sorted according to their PRAL score.
• Negative PRAL scores indicate alkaline foods while positive scores list acidic foods:
| Foodstuffs | Total Purines | Uric Acid mg/100g | Pral Score |
|---|---|---|---|
| Chicken Liver | 312.2 | 363.1 | 20.49 |
| Parsley | 288.9 | 341.3 | -11.13 |
| Shrimp | 273.2 | 321.1 | 12.56 |
| Beef Liver | 219.8 | 255.5 | 22.73 |
| Rainbow Trout | 180.9 | 216.8 | 10.8 |
| Oyster | 184.5 | 213.5 | 1.88 |
| Squid, Spear Squid | 160.5 | 190.0 | 9.37 |
| Beef Topside | 143.5 | 173.8 | 12.5 |
| Chicken Breast | 141.2 | 171.8 | 16.5 |
| Clam, Mussels, Shellfish | 145.5 | 171.5 | 11.1 |
| Mackerel | 139.3 | 171.5 | 7.28 |
| Chicken Wing | 137.5 | 168.1 | 13.93 |
| Octopus | 137.3 | 159.7 | 8.69 |
| Salmon; canned | 132.9 | 159.7 | 14.0 |
| Salmon | 119.3 | 146.2 | 11.5 |
| Tuna Canned | 116.9 | 142.9 | 10.09 |
| Pork, Rump | 113 | 137.8 | 7.9 |
| Fish, Carp | 103.2 | 126.1 | 11.75 |
| Sheep, Mutton | 96.2 | 117.7 | 11.58 |
| Broccoli | 70 | 81.8 | -3.6 |
| Processed Fish; Fish Balls | 67.6 | 80.7 | 7.72 |
| Bacon | 61.8 | 75.6 | 16.56 |
| Bamboo Shoots | 63.3 | 74 | -8.0 |
| Cauliflower | 57.2 | 67.2 | -1.3 |
| Sausage, Frankfurter | 49.8 | 60.5 | 10.6 |
| Eggplant | 50.7 | 58.7 | -3.4 |
| Peanut | 49.1 | 57.1 | 6.2 |
| Rice, brown | 37.4 | 43.7 | 2.3 |
| Beans | * | * | -9.6 |
| Wheat Bread white | 25.8 | 30.3 | -3.55 |
| Rice, polished | 25.9 | 30.3 | 1.7 |
| Soymilk | 22 | 25.8 | -1.6 |
| Shiitake, fresh | 20.8 | 24.4 | -1.4 |
| Tofu | 20 | 23.3 | 2.25 |
| Avocado | 18.4 | 21.8 | -8.2 |
| Garlic | 17 | 20.1 | -2.6 |
| Sweet Potato | 17 | 20.1 | -8.15 |
| Corn | 11.7 | 13.7 | * |
| Asparagus | 10.2 | 12 | -2.2 |
| Cucumber | 9.4 | 11.1 | -5.0 |
| Chinese Cabbage | 7 | 8.2 | -5.0 |
| Potato | 6.5 | 7.5 | -6.08 |
| Cabbage | 3.2 | 3.8 | -4.3 |
| Tomato | 3.1 | 3.7 | -4.1 |
| Banana | 3 | 3.5 | -6.9 |
| Onion | 2.3 | 2.7 | -2.0 |
| Carrot | 2.2 | 2.5 | -5.7 |
| Strawberry | 2.1 | 2.4 | 6.8 |
| Additional Foods; No Uric Acid | Data | ||
| Cheese | 34.0 | ||
| Ice Cream | 28.7 | ||
| Sesame | 0.3 | ||
| Raisins | -21 | ||
| Dates | -11.9 | ||
| Tamarind, raw | -11 | ||
| Textured Vegetable, Protein | dry | -10.58 | |
| Fig | -4.88 | ||
| Seaweed | -4.8 | ||
| Papaya | -4.03 | ||
| Mango | -3.01 | ||
| Pineapple | -2.21 |
♦ Table sorted according to PRAL Score:
| Foodstuffs | Total Purines | Uric Acid mg/100g | Pral Score |
|---|---|---|---|
| Raisins | -21 | ||
| Dates | -11.9 | ||
| Parsley | 288.9 | 341.3 | -11.13 |
| Tamarind, raw | -11 | ||
| Textured Vegetable, Protein | dry | -10.58 | |
| Beans | * | * | -9.6 |
| Avocado | 18.4 | 21.8 | -8.2 |
| Sweet Potato | 17 | 20.1 | -8.15 |
| Bamboo Shoots | 63.3 | 74 | -8.0 |
| Banana | 3 | 3.5 | -6.9 |
| Potato | 6.5 | 7.5 | -6.08 |
| Carrot | 2.2 | 2.5 | -5.7 |
| Cucumber | 9.4 | 11.1 | -5.0 |
| Chinese Cabbage | 7 | 8.2 | -5.0 |
| Fig | -4.88 | ||
| Seaweed | -4.8 | ||
| Cabbage | 3.2 | 3.8 | -4.3 |
| Tomato | 3.1 | 3.7 | -4.1 |
| Papaya | -4.03 | ||
| Broccoli | 70 | 81.8 | -3.6 |
| Wheat Bread, white | 25.8 | 30.3 | -3.55 |
| Eggplant | 50.7 | 58.7 | -3.4 |
| Mango | -3.01 | ||
| Garlic | 17 | 20.1 | -2.6 |
| Pineapple | -2.21 | ||
| Asparagus | 10.2 | 12 | -2.2 |
| Onion | 2.3 | 2.7 | -2.0 |
| Soymilk | 22 | 25.8 | -1.6 |
| Shiitake, fresh | 20.8 | 24.4 | -1.4 |
| Cauliflower | 57.2 | 67.2 | -1.3 |
| Sesame | 0.3 | ||
| Rice, polished | 25.9 | 30.3 | 1.7 |
| Oyster | 184.5 | 213.5 | 1.88 |
| Tofu | 20 | 23.3 | 2.25 |
| Rice, brown | 37.4 | 43.7 | 2.3 |
| Peanut | 49.1 | 57.1 | 6.2 |
| Strawberry | 2.1 | 2.4 | 6.8 |
| Mackerel | 139.3 | 171.5 | 7.28 |
| Processed Fish; Fish Balls | 67.6 | 80.7 | 7.72 |
| Pork, Rump | 113 | 137.8 | 7.9 |
| Octopus | 137.3 | 159.7 | 8.69 |
| Squid, Spear Squid | 160.5 | 190.0 | 9.37 |
| Tuna Canned | 116.9 | 142.9 | 10.09 |
| Sausage, Frankfurter | 49.8 | 60.5 | 10.6 |
| Rainbow Trout | 180.9 | 216.8 | 10.8 |
| Clam, Mussels, Shellfish | 145.5 | 171.5 | 11.1 |
| Salmon | 119.3 | 146.2 | 11.5 |
| Sheep, Mutton | 96.2 | 117.7 | 11.58 |
| Fish, Carp | 103.2 | 126.1 | 11.75 |
| Beef Topside | 143.5 | 173.8 | 12.5 |
| Shrimp | 273.2 | 321.1 | 12.56 |
| Chicken Wing | 137.5 | 168.1 | 13.93 |
| Salmon; canned | 132.9 | 159.7 | 14.0 |
| Chicken Breast | 141.2 | 171.8 | 16.5 |
| Bacon | 61.8 | 75.6 | 16.56 |
| Chicken Liver | 312.2 | 363.1 | 20.49 |
| Beef Liver | 219.8 | 255.5 | 22.73 |
| Ice Cream | 28.7 | ||
| Cheese | 34.0 |
- [a] The Alkaline Diet: Is There Evidence That an Alkaline pH Diet Benefits Health?
When it comes to the pH and net acid load in the human diet, there has been considerable change from the hunter gather civilization to the present.
With the agricultural revolution (last 10,000 years) and even more recently
with industrialization (last 200 years), there has been an decrease in potassium (K) compared to sodium (Na) and an increase in chloride compared to bicarbonate found in
the diet.
The ratio of potassium to sodium has reversed, K/Na pre-viously was 10 to 1 whereas the modern diet has a ratio of 1 to 3.
It is generally accepted that agricultural humans today have a diet poor in magnesium and potassium as well as fiber and rich in saturated fat, simple sugars, sodium, and chloride as compared to the pre-agricultural period.
This results in a diet that may induce metabolic acidosis which is mismatched to the genetically determined nutritional requirements.
With aging, there is a gradual loss of renal acid-base regulatory function and a resultant increase in diet-induced metabolic acidosis while on the modern diet.
A low-carbohydrate high-protein diet with its increased acid load results in very
little change in blood chemistry, and pH, but results in many changes in urinary chemistry.
Urinary magnesium levels, urinary citrate and pH are decreased, urinary calcium,
undissociated uric acid, and phosphate are in-creased.
All of these result in an increased risk for kidney stones.
Gerry K. Schwalfenberg; University of Alberta, Suite No. 301, 9509-156 Street, Edmonton, AB, Canada T5P 4J5
- [β] Nutrient Intake Is Associated with Longevity
Characterization by Metabolites and Element Profiles of Healthy Centenarians
Abstract:
.... Seven characteristic components closely related to the centenarians were identified, including acetic acid, total SCFA, Mn, Co, propionic acid, butyric acid and valeric acid.
Their concentrations were significantly higher in the centenarians group (p < 0.05).
Additionally, the dietary fiber intake was positively associated with butyric acid contents in feces (r = 0.896, p < 0.01), and negatively associated with phenol in urine (r = −0.326, p < 0.01).
The results suggest that the specific metabolic pattern of centenarians may have an important and positive influence on the formation of the longevity phenomenon.
Conclusions
The results indicated that the unique metabolic pattern of the LRC (100 years plus) group may have an important and positive influence on the formation of the longevity phenomenon.
• Elevated dietary fiber intake should be a path toward health and longevity.
PMID: 27657115 PMCID: PMC5037549 DOI: 10.3390/nu8090564
- [γ] Purine-rich foods, protein intake, and the prevalence of hyperuricemia: The Shanghai Men’s Health Study
In this study of 3,978 middle-aged men living in Shanghai, we found that intake of protein from animal sources and seafood was associated with higher prevalence of hyperuricemia, while soy products appeared to decrease hyperuricemia risk.
The associations of animal protein intake and plant protein intake with hyperuricemia were not independent of each other.
Protein from animal sources was significantly associated with prevalence of hyperuricemia.
PMCID: PMC3150417 NIHMSID: NIHMS269905 PMID: 21277179
- [Δ] Dietary acid load: Mechanisms and evidence of its health repercussions.
Currently, chronic noncommunicable diseases (CNDs) represent a public health problem, accounting for 70% of deaths in developing countries.
• The main CNDs are cardiovascular disease, cancer, chronic respiratory diseases and diabetes.
Historically, an association has been reported between the feeding pattern and the development or progression of metabolic disorders and CNDs.
In recent years one aspect that has received attention is the impact of the micronutrient profile on the maintenance of acid / base equilibrium, describing the deleterious impact of metabolic acidosis (MA) on health status.
The objective of the present review is to analyze the available evidence of the dietary acid load in different clinical conditions.
Conclusions
According to the literature, the type of diet can profoundly affect the organism by providing acid precursors or bases.
Diets with high acid load produces changes in the acid base balance.
There is an association between low-grade metabolic acidosis with the development of chronic noncommunicable diseases.
The implementation of strategies aiming to reduce the acid load of the diet through nutritional interventions may have a positive impact on health
PMID: 30737117 DOI: 10.1016/j.nefro.2018.10.005
- [ε] A Vegan Diet Is Associated with a Significant Reduction in Dietary Acid Load: Post Hoc Analysis of a Randomized Controlled Trial in Healthy Individuals
• Our results confirm the hypothesis that a short-term (isocaloric) vegan dietary intervention effectively reduces DAL (Daily Acid Load) in healthy individuals, whereas a meat-rich diet increases it.
Our results are consistent with the majority of intervention studies investigating the DAL-lowering effects of various plant-based diet patterns.
In a recently published trial, Kahleova et al. randomized 244 overweight adults to either an ad libitum low-fat vegan diet (LFVD) or a control diet.
The LFVD predominantly included grains, legumes, vegetables and fruits and was characterized by a targeted macronutrient distribution of ~75% of energy from carbohydrates, 15% protein and 10% fat.
The control group was requested to avoid any dietary modifications.
After 16 weeks, median PRAL and NEAPF scores fell significantly in the vegan intervention group (−24.3 (−28 to −20.5) mEq/day and −25.1 (−29.1 to −21.1) mEq/day, respectively).
PMCID: PMC8507786 PMID: 34639299


